


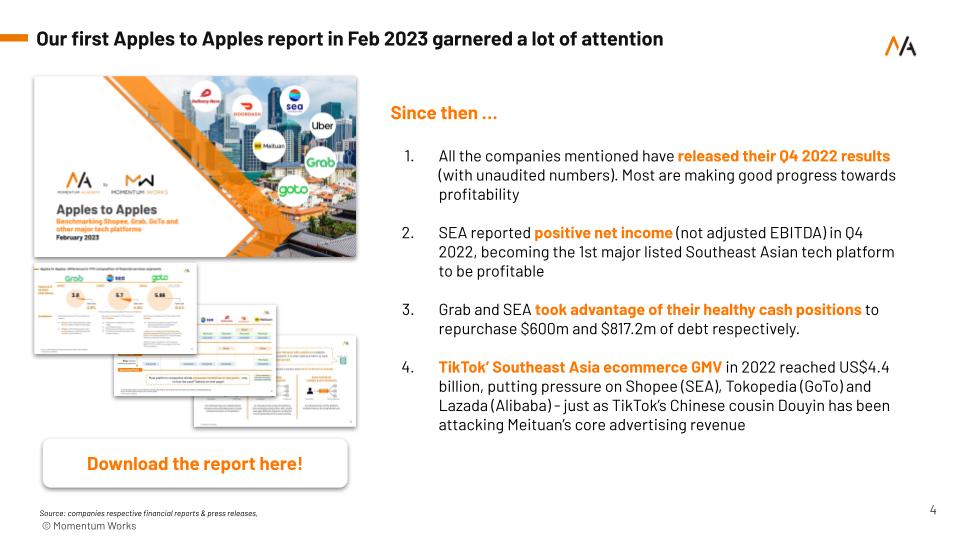
In February this year Momentum Academy launched our first Apples to Apples: benchmarking major tech platforms report where we broke down the myriad of metrics platforms companies use to report their business performance.
The rationale for the report was simple: major tech platforms have become an integral part of our lives in many major cities across the world – yet it is so hard to make sense of their performance as they, as new additions to the public market, report performance using very different metrics. Even if they use similar metrics, the methodology of how they get to the metric can differ.
The report has been downloaded more than 2000 times from our site – and we have had further discussions with many of you.
Since the launch, all the companies covered – Uber, Grab, GoTo, Sea, Delivery hero, Doordash, and Meituan – have reported their Q4 and FY 2022 results, with some interesting new developments:
Therefore, we are issuing an update to the report, called Apples to Apples 2.0. In this latest edition, we have also included Zomato, the listed food delivery platform from India (which also has some business in the UAE), into our analysis.
The Apples to Apples 2.0 report is complimentary – you can get a copy here.
This latest edition goes beyond just updating numbers from the previous report. We have also added some new metrics that provide interesting insights into the business performance of the companies mentioned.
Some new key insights from the latest report:
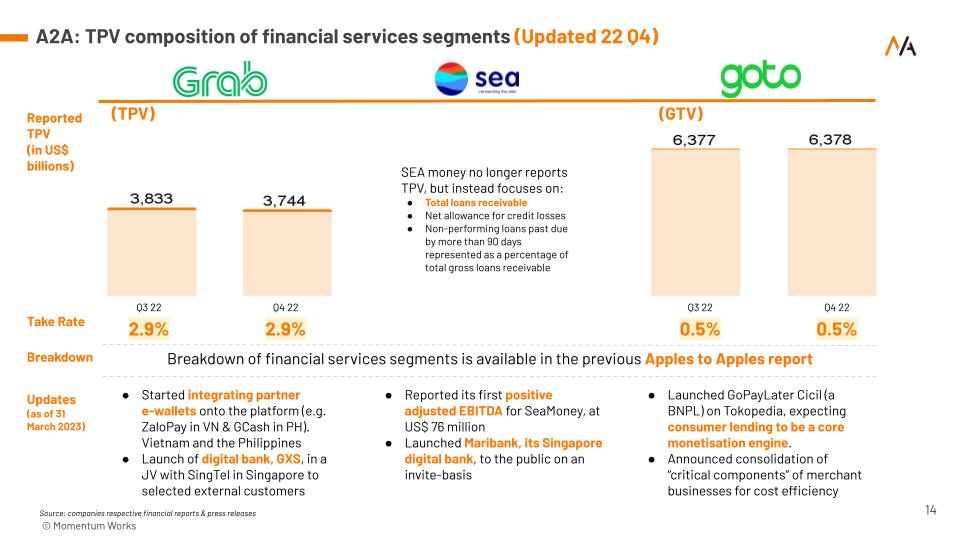
- The latest updates on the financial services segments of Sea, Grab and GoTo
Since our last report, the 3 Southeast Asian tech giants have made a number of new moves in their fintech offerings – including the digital banks of Grab and SEA Group.
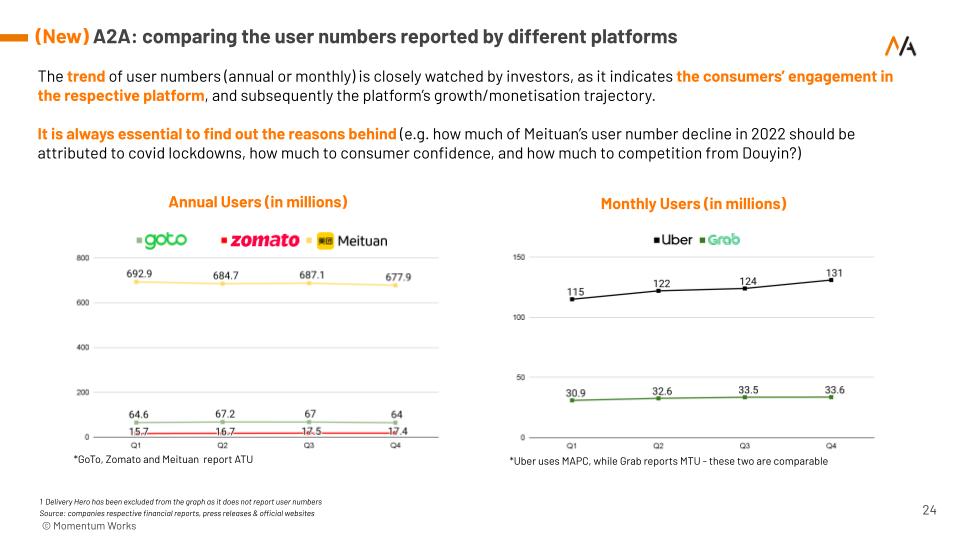
- Examine user trends instead of the user numbers reported by different platforms
It is worth noting that these companies operate in different regions, and as such comparing the user numbers between them does not provide an apples to apples comparison. Instead, it’s more useful to examine the trend of user numbers over time for each company which indicates consumers’ engagement with the platforms.
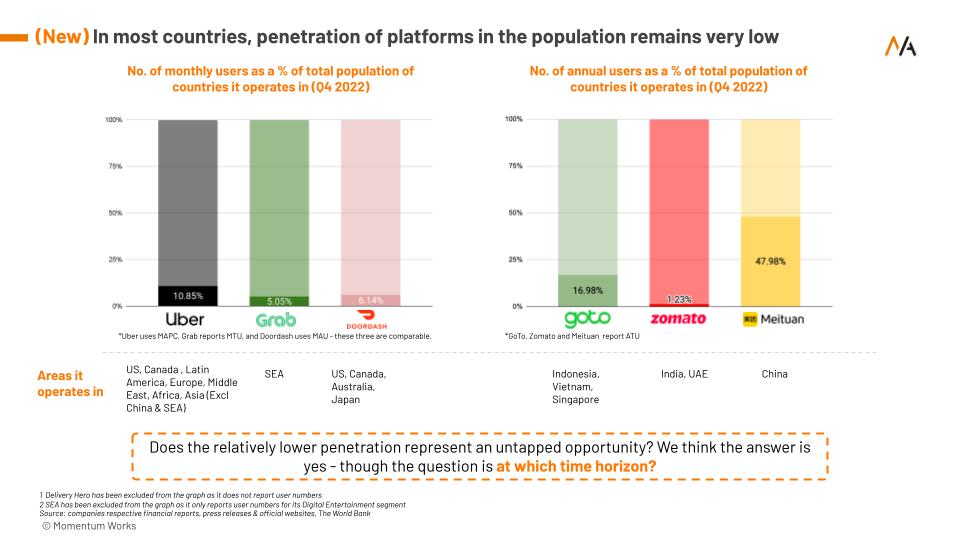
- Penetration of platforms in the countries they operate in
Untapped opportunity – but at which time horizon?
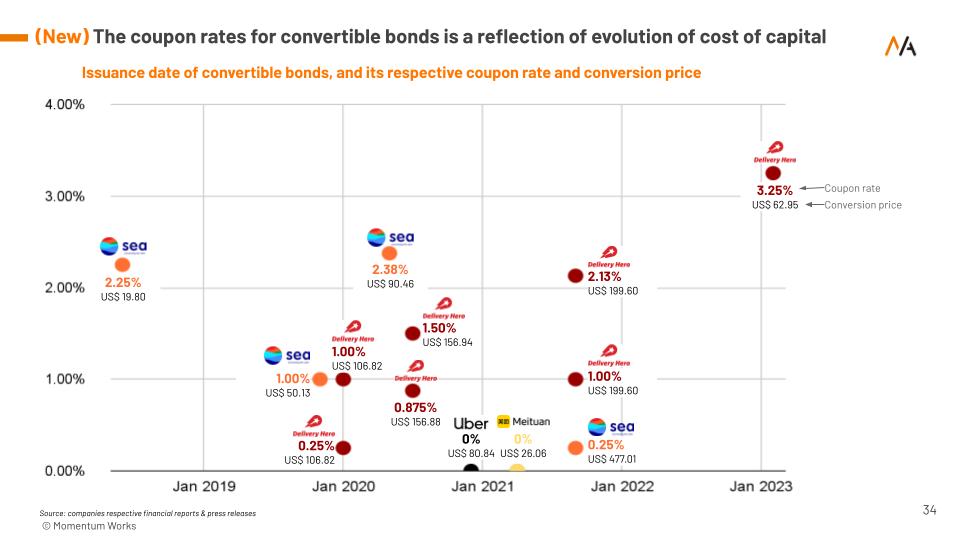
- The coupon rates for convertible bonds is a reflection of evolution of cost of capital
Some companies issue convertible bonds to raise capital for a variety of reasons, and the coupon rates of these convertible bonds can indicate how the cost of capital has changed over time. It also reflects how investors perceive the risk and return of investing in convertible bonds issued by a company, and how this perception can change over time.
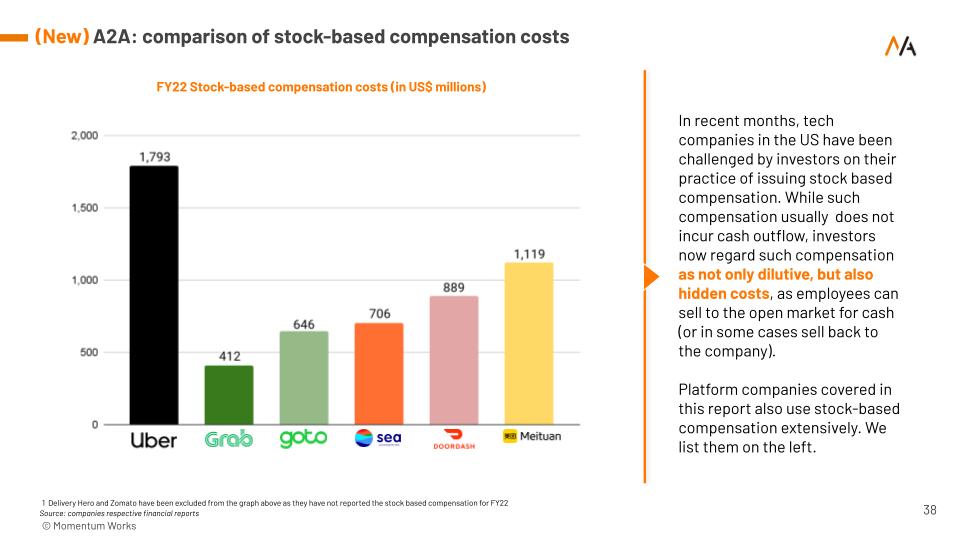
- Comparison of stock-based compensation costs and its impact on cash flow
Once again, it is important to note that the numbers, reported or derived, are not everything in determining these companies eventual success (or otherwise).
This is not only because such numbers mainly reflect the recent history, or a snapshot at a recent quarter end. There are many important factors to consider beyond metrics – notably Leadership, People, Organisation and Product, as we have indicated in our recent book Seeing the unseen: behind Chinese tech giants’ global venturing. These factors evolve as well – for example, what happens when the founding CEO leaves a company?
If you would like to have a sharing on gaining a deeper understanding of the financial performance of major tech platforms and other insights for your leadership team, you are welcome to contact Momentum Academy ([email protected]).


