


Beyond the Numbers: Interpreting User Metrics from Platform Companies
For many platform companies, the trend of user numbers is closely watched by investors, as it indicates the consumers’ engagement in the respective platform, and subsequently the platform’s growth/monetisation trajectory. And for these platform companies, a healthy and loyal user base is of utmost importance as it will translate to profitability eventually.
However, there is much intricacy in interpreting the user metrics from platform companies.
Momentum Academy’s Apples to Apples 2.0 report aims to breakdown these metrics, and help you make sense of them. Here are some ways to make sense of these metrics.
-
User numbers are very important to platforms, but they measure differently
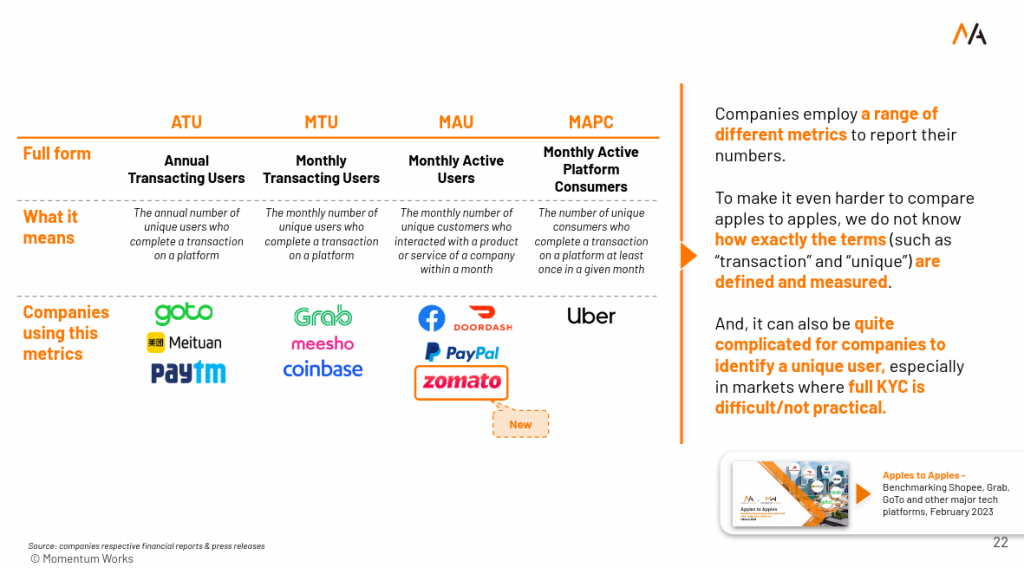 Even though many platform companies report user metrics, different companies often report different variations of it, making it hard to compare apples to apples.
Annual numbers would of course be larger than quarterly numbers, which in turn are larger than monthly numbers; “Active” user numbers are larger than “transacting” user numbers. These are important keywords to take into consideration when looking at the user metrics reported by platform companies.
-
There is also ambiguity behind how a company actually identifies a “unique” user. How do you know when a user is unique?

It can be quite complicated for companies to identify a unique user, especially in markets where full KYC is difficult or not desirable. As such, how does a company determine a unique user? Is a mobile number unique enough? What happens when people have multiple mobile numbers? It is almost impossible for a company to know exactly how many users they have.
-
The trend of any number, if reported consistently, can be quite important in telling the platform’s growth
Take Garena, the digital entertainment subsidiary of SEA group for example: What is the story behind Garena’s user number trend?
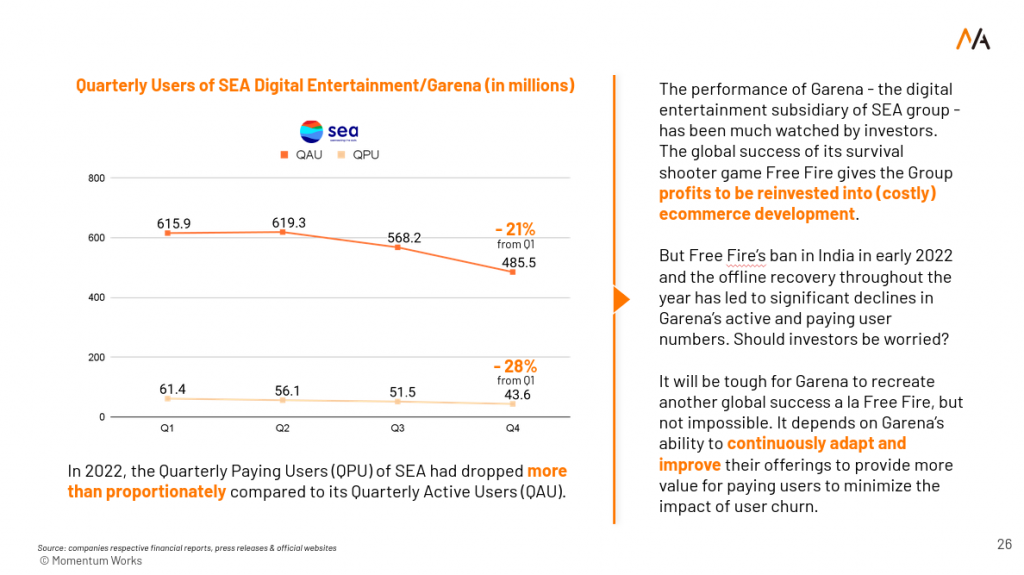
The Quarterly Paying Users and Quarterly Active Users have been on a downtrend since the start of 2022. While the user number trend is important, the reasons that contributed to the trend as well as what the company is doing to adapt and improve its offerings to reduce user churn would be of greater concern to investors, as it explains the circumstances that led to the trend.
- The number needs to be compared to the population of the consumers the platform is serving to assess penetration and growth aspects
In most countries, penetration of platforms in the population remains very low. This represents an untapped opportunity for these platforms, but the question is when?
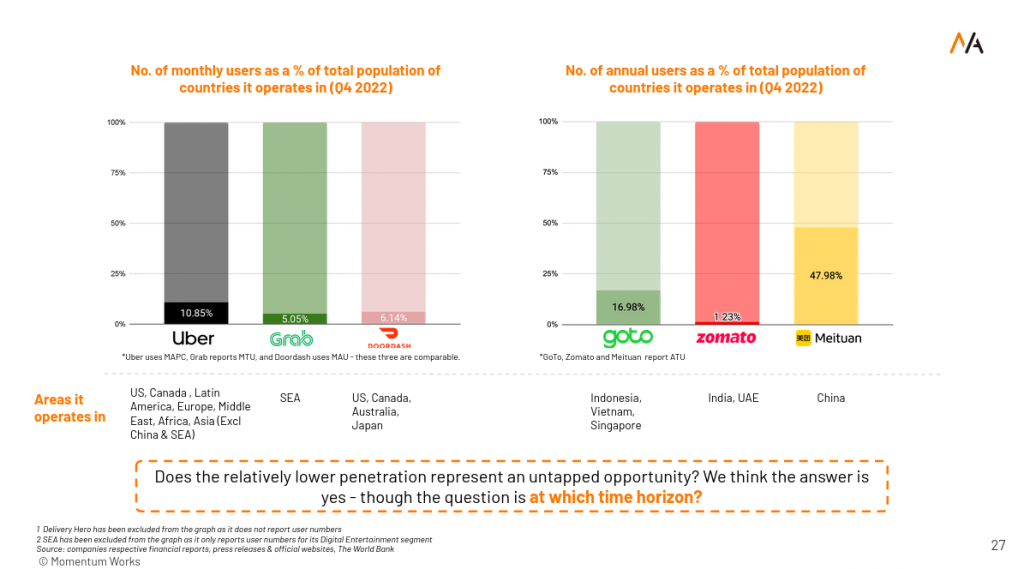
The penetration rate of such platform companies (percentage of users against total population of countries they operate in), provide an insight as to what stage the platform company is currently at and their growth prospects.
Throughout the report, we seek not to prove which platform company is better (or worse) than its peers, but rather to put the differences in reporting key metrics in a clear, comprehensive and comparable way such that you can draw your own conclusions in an informed manner.
The Apples to Apples 2.0 report is complimentary – you can get a copy here.
Some of you have asked for a sharing on this topic and our other insights to your team in April and we are looking forward to it! If you would like us to give a sharing on any insights that we share here with your team in May, give us a shoutout at Momentum Academy ([email protected]). We have limited slots available but want to find ways to make our insights useful to our community!


