


Major tech platforms companies, such as SEA Group, Grab, GoTO, Meituan and Zomato have become an integral part of our lives today. Most of them have gone public in the last few years – drawing a lot of attention from other startups that want to learn from them, as well as corporations and investors that are looking to invest in or partner with them.
But what makes comprehending the financial metrics of tech platform companies so challenging, and even more so when comparing them side by side?
- Platform companies are operating in a new and emerging business model
These new and emerging business models have not been fully captured by traditional accounting standards. As such, the accounting standards for platform companies are not clear, and these companies often use alternative accounting methods that are not easily understood by investors or analysts making it challenging to compare their financial metrics accurately.
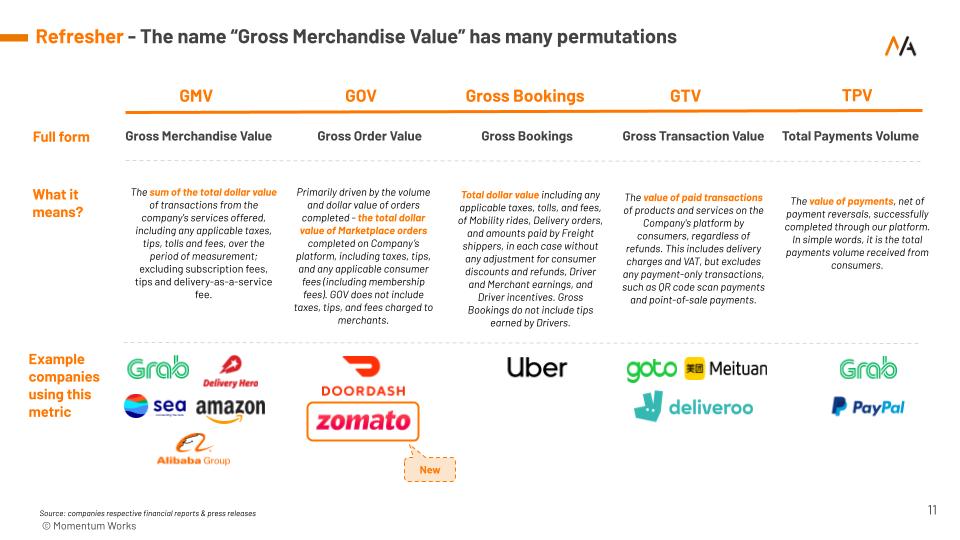
For example, traditional companies would use revenue or income as a proxy of sales; For platform companies there are “Gross Merchandise Value” (GMV) and many other permutations – each one meaning something different.
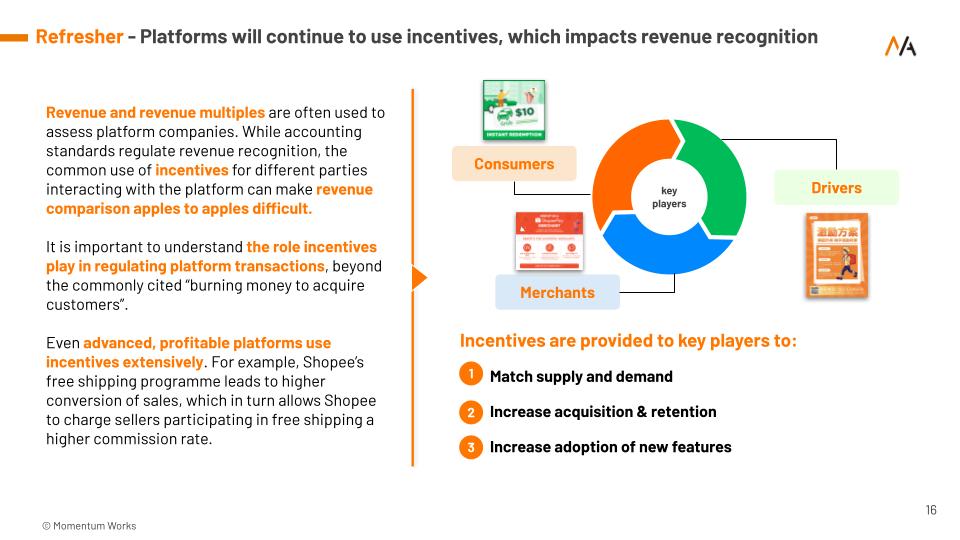
- The incentives that platform companies offer differs a lot from traditional companies
Traditional companies typically provide discounts, which are straightforward price reductions, to drive short-term customer sales.
Platform companies, however, due to their business model, have a myriad of incentives for customers, drivers, and merchants. These incentives are often tailored to specific user behaviours or preferences, and can help build long-term engagement with the platform.
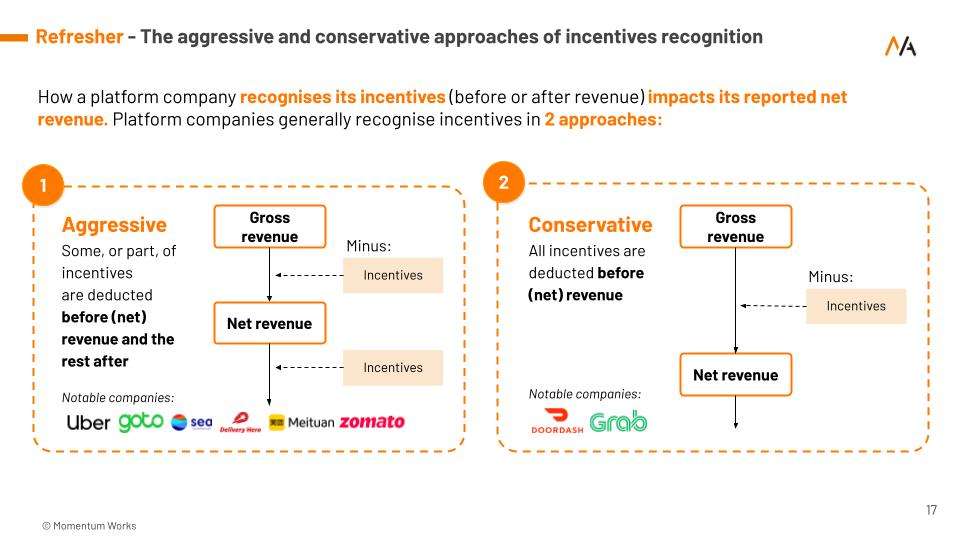
- And the accounting of these incentives to derive revenue is complicated
And even when these companies use similar metrics, different companies have different ways to recognise the incentives that affect their reported net revenue.
For example, GoTo deducts incentives both before and after net revenue (aggressive approach), while Grab only deducts incentives before net revenue (conservative approach). As such, comparing the net revenues reported does not provide an apples to apples comparison.
Comparing the financial metrics of platform companies is a challenging task. This article is just the tip of the iceberg. There are other indicators to consider such as cash flow, user metrics and qualitative measures like leadership and people.
That is why Momentum Academy launched the 2nd edition of our Apples to apples report, where we broke down the myriad of metrics platforms companies use to report their business performance. We also looked at new metrics that provide interesting insights into the business performance of the platform companies mentioned.
Some of you have asked for a sharing on this topic and our other insights to your team in April and we are looking forward to it! If you would like us to give a sharing on any insights that we share here with your team in May, give us a shoutout at Momentum Academy ([email protected]). We have limited slots available but want to find ways to make our insights useful to our community!


